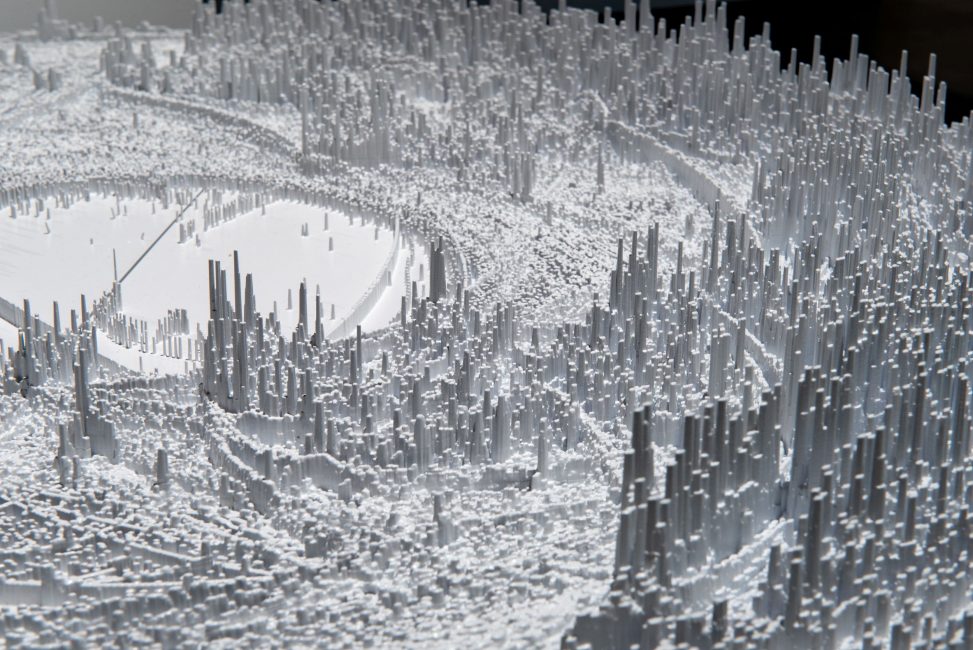
National emissions inventories record the greenhouse gases each country releases every year, broken down by a hierarchy of sectors such as energy, industry, agriculture, transport and heating. The Emissions Database for Global Atmospheric Research (EDGAR)1 estimates emissions for every country in the same way, then allocates them to a 0.1° grid, cells roughly 11 km across, using proxy locations such as power plants, road networks and population, for every year from 1970 to 2018.
Carbon Topographies extrudes this grid into 3D-printed relief models in polar and global projections, in which the structures of the world’s economies rise as moraines and intrusions across the continents and the routes of ships and aircraft striate the oceans.
Notes
- EDGAR, ‘EDGAR Global Greenhouse Gas Emissions, v5.0’, EDGAR – Emissions Database for Global Atmospheric Research, 2020, https://edgar.jrc.ec.europa.eu/dataset_ghg50. ↩
Part of Planetary Assemblages.