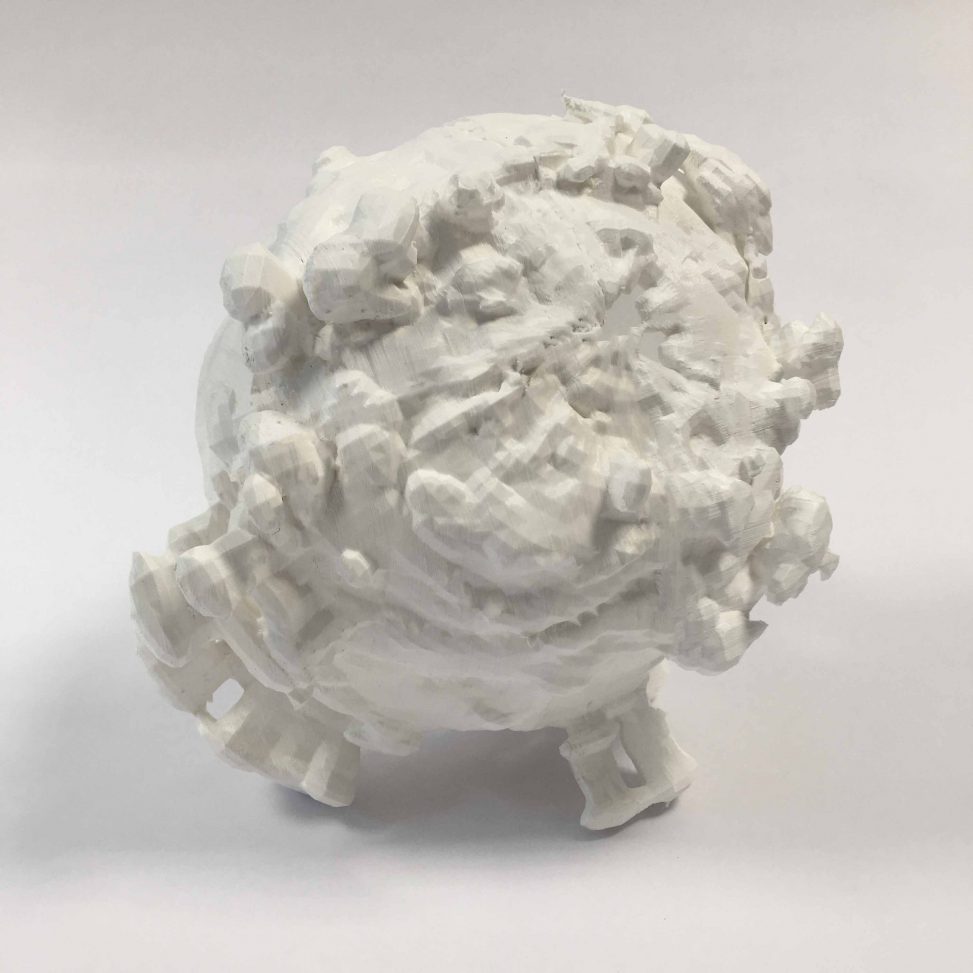
Atmospheric CO₂ is in continuous flux, following the rhythms and processes of its major sources and sinks. Computational models represent this dynamic by dividing the atmosphere into a three-dimensional grid of cells and calculating the concentration of CO₂ in each. NOAA’s CarbonTracker1 combines atmospheric measurements with a model of atmospheric transport to reconstruct CO₂ from 2000 to 2018, separating the contributions of fossil fuels, fires, vegetation and the oceans.
Projecting forward to the end of the century, Earth system models such as GFDL ESM2M2 and CNRM-ESM2-13 simulate a range of future emissions pathways, in which the dynamics of CO₂ contributions play out differently depending on the levels of anthropogenic emissions.
Atmospheric Engines transforms these volumes into sculptures, printing surfaces of equal CO₂ concentration as solid forms and exposing the grid of model cells as lattices. The temporal patterns are revealed by animations of these volumes that show the daily pulse of natural fluxes, and the billowing from fossil fuels circling the planet.
Notes
- NOAA, ‘CarbonTracker CT2019B’, NOAA Global Monitoring Laboratory, 2020, https://gml.noaa.gov/ccgg/carbontracker/CT2019B/. ↩
- John P. Dunne et al., ‘GFDL’s ESM2 Global Coupled Climate–Carbon Earth System Models. Part I: Physical Formulation and Baseline Simulation Characteristics’, Journal of Climate 25, no. 19 (2012): 6646–65, https://doi.org/10.1175/JCLI-D-11-00560.1. ↩
- Roland Séférian et al., ‘Evaluation of CNRM Earth System Model, CNRM‐ESM2‐1: Role of Earth System Processes in Present‐Day and Future Climate’, Journal of Advances in Modeling Earth Systems 11, no. 12 (2019): 4182–227, https://doi.org/10.1029/2019MS001791. ↩
Part of Planetary Assemblages.