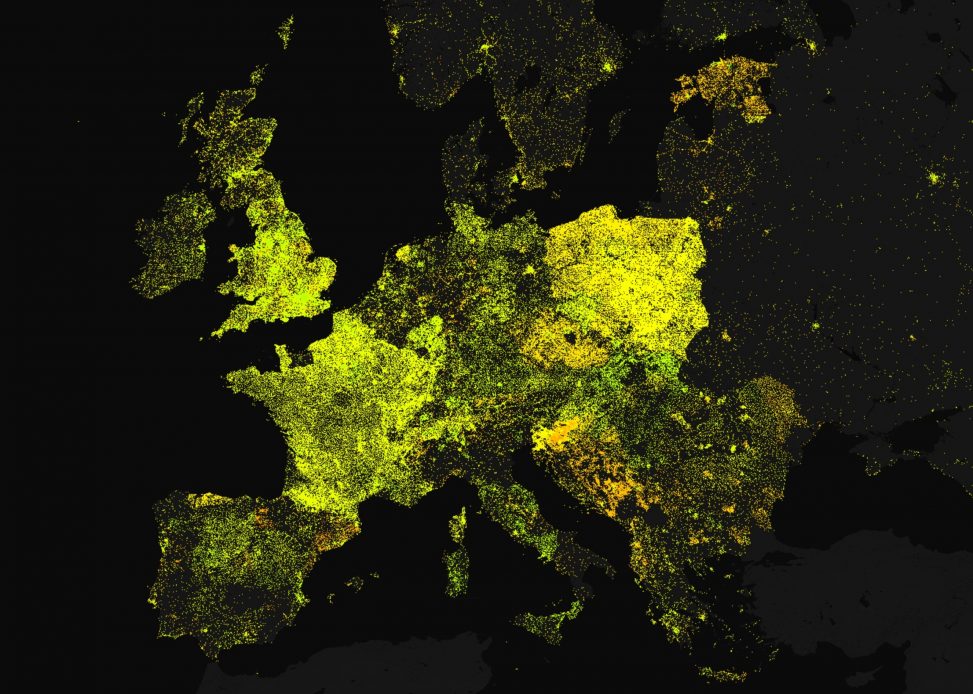
Mapping Wikipedia visualises all the geo-located articles for a number of languages. Each point on the map is an article that refers to a location somewhere on the earth. This could be a place, a geographic feature, the site of an historic event, a shipwreck, or even a fictional island. Please note, the map doesn’t tell us about the location of Wikipedia authors, it shows the location of article subjects.
The project was developed in collaboration with Mark Graham and Bernie Hogan at the Oxford Internet Institute, and uses the dataset they created for their project focusing on Wikipedia in the Middle East and North Africa in addition to the GeoHack and Kolossus projects on the Wikipedia Toolserver.
Language Maps
The images below show the global distribution of articles written in each language. For an analysis of what the distribution patterns tell us see Mark Graham’s geography of Wikipedia’s augmentations of our planet..
Article Metrics
To further explore the geography of the data, each Wikipedia article is associated with various attributes, such as word count, number of authors, and number of images etc. You can investigate these using the ‘map’ dropdown. Here are a few examples for Europe, Asia and the US.
How it was built
The project was developed using Open Layers. To display the large number of articles we wrote a subclass of the Open Layers Canvas renderer, and optimised for point plotting. A Google basemap was produced using the Styled Map Wizard. Mike Chambers’ Quadtree was used for mouse-picking the individual articles.
Exhibitions & Media
Information is Beautiful Awards / Shortlist →
visualizing.org curated exhibition at Ars Electronica 2012 →
Wikisym 2012 →
Guardian Data Blog →
infosthetics →
FlowingData →
Floating Sheep →
Visual.ly →
Scoop.it →
Fast Co.Design →
nrc.nl →
Date: 2012